3. Electric energy consumption
One of the basic issues of green computing is the electric energy consumption. It is especially important due to the emergence of huge data centers that operate on data stored in the cloud computing.
This topic consists of the following sections:
- Measurement - How to measure power consumption?
- Energy consumption - How much electric energy computers use?
- Cost of energy - How much it costs?
- Questions - A set of questions to check the material master.
Work
The work \(W\) for AC powered devices is calculated as follows:
\[
W=U_{RMS} \cdot I_{RMS} \cdot t
\]
where
- \(W\) is a work
- \(U_{RMS}\) is a root mean square voltage in volts (in Poland 230 V)
- \(I_{RMS}\) is a root mean square electric current in amps
- \(t\) is a time in seconds
Power
Power is a work done in a unit of time: \[ P = {{W} \over {t}} \] where
- \(P\) is a power
- \(W\) is a work in joules
- \(t\) is a time in seconds
The kilowatt is equal to one thousand (\(10^3\)) watts.
The megawatt is equal to one million (\(10^6\)) watts.
The gigawatt is equal to one billion (\(10^9\)) watts or 1 gigawatt = 1000 megawatts.
The terawatt is equal to one trillion (\(10^{12}\)) watts.
Laptops
The average power consumption can range from 20W for a netbook to 110W for a gaming laptop:
model
power consumption
watts
netbook Intel Atom N450, 1GB RAM
20
laptop Intel Core i7-720QM, 4GB DDR3 RAM, 16" LED
50
laptop Intel Core i3-330M, 3GB DDR3 RAM, 15.6" LED
65
laptop Intel Core i7-720QM, 8GB DDR3 RAM, 17,3" Full HD
103
Monitors
For some applications, especially for the artists, CRT monitors are better for the close to realistic representation of colors. For many other uses TFT surpass CRTs.
TFT monitor consumes much less power than CRT monitor. The following table compares the power consumption of some selected monitors.
type
model
Brightness 100%
Brightness 50%
Brightness 10%
TFT
Acer E225HQL 22"
18
13
9
TFT
Philips 190BW9 19"
31
21
12
TFT
BenQ FP937S 19"
31
24
21
TFT
Samsung SyncMaster 204B 20"
34
25
18
TFT
Samsung SyncMaster 245B plus 24"
66
44
26
CRT
Iiyama Vision Master Pro 454 19"
102
98
91
CRT
Sony CPD-G420 19"
111
103
99
Desktops
The following table presents power consumption of selected desktop computers.
Configuration
Power
[W]
Intel Pentium Dual-Core E5200, 2GB DDR3 RAM, SATA HD 5400 RPM, GPU Intel GMA X4500
110
Intel Core i3-530, 4GB DDR3 RAM, SATA HD 7200 RPM, GPU ATI Radeon HD 5670
200
Intel Core i7 920, 6GB DDR3 RAM, SATA HD 7200 RPM, GPU GeForce GTX 580
500
Supercomputers
The Top 500 contains the list of 500 supercomputers sorted by performance measured in FLOPS i.e. floating point instructions per second (MFLOPS is equal to \(10^6\) FLOPS, GFLOPS is equal to \(10^9\) FLOPS, TFLOPS is equal to \(10^{12}\) FLOPS).
The following table contains the top 10 supercomputers with maximal performance (Rmax). The last column shows the power consumption in kilowatts.
Rank
System
Cores
Rmax
[TFLOPS]Power
[KW]
1
Tianhe-2 - TH-IVB-FEB Cluster
3,120,000
33,862.7
17,808
2
Titan - Cray XK7
560,640
17,590.0
8,209
3
Sequoia - BlueGene/Q
1,572,864
17,173.2
7,890
4
K computer
705,024
10,510.0
12,660
5
Mira - BlueGene/Q
786,432
8,586.6
3,945
6
Piz Daint - Cray XC30
115,984
6,271.0
2,325
7
Stampede - PowerEdge C8220
462,462
5,168.1
4,510
8
JUQUEEN - BlueGene/Q
458,752
5,008.9
2,301
9
Vulcan - BlueGene/Q
393,216
4,293.3
1,972
10
Cray CS-Storm
72,800
3,577.0
1,499
The important criterion for green computing is the performance in MFLOPS per watt of power consumption. For instance the fastest supercomputer Tianhe-2 has 1,901.54 MFLOPS/W.
Cloud computing
Report How Clean is Your Cloud? by Greenpeace : 1 presents the analysis of power consumption of the largest clouds (Facebook, Amazon, Apple, Microsoft, Google, Yahoo and others).
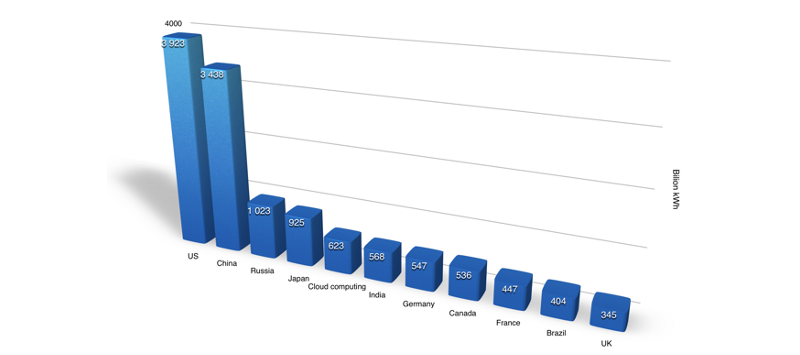
The following figure shows the electric consumption in 2007 (data from : 1 ):

Fig. 3/1: 2007 electricity consumption
The cloud computing in 2007 consumed much more power than the fifth country in the world (e.g. India).
Formula for cost of energy
The formula for cost of energy is as follows: \[ C={{P} \over {1000}} \cdot t \cdot p \] where
- \(P\) is a power in watts
- \(t\) is a time in hours
- \(p\) is a price in zlotys per one kilowatt-hour (average 0.56 PLN in 2014)
The simple calculator of energy costs is available on the page energyusecalculator.com .
- What is the unit of work?
- What is the unit of power?
- What is the gigawatt?
- Is the monitor consumes more power in high or low Brightness?
- How green is your computer i.e. how many MFLOPS/W it has?
- What is the cost of energy consumed by your computer in a one hour, a one day, a one month and a one year?
Greenpeace: How Clean is Your Cloud?
P. Schmid, A. Roos: Display power consumption: CRTs Versus TFT-LCDs
Tom's Hardware, August 2010. http://www.tomshardware.com/
J. Klimkowicz: Ile kosztuje dzień pracy komputera?
PC Skan, December 2010 (in polish) http://pcskan.gadzetomania.pl/2010/12/14/ile-kosztuje-dzien-pracy-komputera
www: The Top 500 supercomputers
November 2014 http://top500.org/lists/2014/11/
www: The Green 500 supercomputers
November 2014 http://www.green500.org/lists/green201411